NA-MIC/Projects/Theme/Template

Contents
See this page for a format suggestion.
Objective
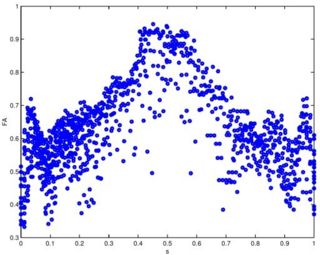
We are developing methods for analyzing diffusion tensor data along fiber tracts. The goal is to be able to make statistical group comparisons with fiber tracts as a common reference frame for comparison.
Approaches and Challenges
Our approach for analyzing diffusion tensors is summarized in the IPMI 2007 reference below. The main challenge to this approach is <foo>.
Progress
June 2007 (Project Week)
This is where you put in progress made in Project Week 2007.
January 2007
Software for the fiber tracking and statistical analysis along the tracts has been implemented. The statistical methods for diffusion tensors are implemented as ITK code as part of the DTI Software Infrastructure project. The methods have been validated on a repeated scan of a healthy individual. This work has been published as a conference paper (MICCAI 2005) and a journal version (MEDIA 2006). Our recent IPMI 2007 paper includes a nonparametric regression method for analyzing data along a fiber tract.
Publications
- Fletcher, P.T., Tao, R., Jeong, W.-K., Whitaker, R.T., "A Volumetric Approach to Quantifying Region-to-Region White Matter Connectivity in Diffusion Tensor MRI," to appear Information Processing in Medical Imaging (IPMI) 2007.
- Corouge, I., Fletcher, P.T., Joshi, S., Gilmore, J.H., and Gerig, G., "Fiber Tract-Oriented Statistics for Quantitative Diffusion Tensor MRI Analysis," Medical Image Analysis 10 (2006), 786--798.
- Corouge, I., Fletcher, P.T., Joshi, S., Gilmore J.H., and Gerig, G., Fiber Tract-Oriented Statistics for Quantitative Diffusion Tensor MRI Analysis, Lecture Notes in Computer Science LNCS, James S. Duncan and Guido Gerig, editors, Springer Verlag, Vol. 3749, Oct. 2005, pp. 131 -- 138
- C. Goodlett, I. Corouge, M. Jomier, and G. Gerig, A Quantitative DTI Fiber Tract Analysis Suite, The Insight Journal, vol. ISC/NAMIC/ MICCAI Workshop on Open-Source Software, 2005, Online publication: http://hdl.handle.net/1926/39 .
Key Investigators
- UNC: Isabelle Corouge, Casey Goodlett, Guido Gerig
- Utah: Tom Fletcher, Ross Whitaker
Representative Images
Additional Links
This is where you can put in additional links either on this wiki our outside that provide details of this project.
Testing Out a format
Objective
Approach and Challenges
Results
Announcements
News
Blogs
Based on format at http://www.linux-foundation.org/.
A table created in google docs
http://docs.google.com/View?docid=dhh84kfj_0cddfnx&revision=_published
Can it have a table in it? Maybe so...:
| Days | Weeks |
| Short | Long |

