Difference between revisions of "2009 Winter Project Week ChangeTracker"
| Line 46: | Line 46: | ||
* ''CompareView'' for results visualization: worked with Jim to implement changes to configure the layout with CompareView, but still debugging setting images for slice views | * ''CompareView'' for results visualization: worked with Jim to implement changes to configure the layout with CompareView, but still debugging setting images for slice views | ||
* ''Module error handling'': discussed with Jim changes to the module error handling in Slicer (see below) | * ''Module error handling'': discussed with Jim changes to the module error handling in Slicer (see below) | ||
| + | * ''Longitudinal lesion analysis in Lupus'': put together a [http://wiki.na-mic.org/Wiki/index.php/ChangeTracker:Lupus_DBP requirement document] with the desired features in ChangeTracker (or ChangeTracker derivative) | ||
</div> | </div> | ||
| Line 51: | Line 52: | ||
</div> | </div> | ||
| + | |||
| + | ==="Customer" projects=== | ||
| + | |||
| + | * [http://wiki.na-mic.org/Wiki/index.php/NCI_Evaluating_NA-MIC_Tools_for_Image_Analysis Evaluating NA-MIC tools for image analysis] | ||
| + | * [http://wiki.na-mic.org/Wiki/index.php/2009_Winter_Project_Week:LongitudinalLesions Longitudinal lesion analysis in Lupus] | ||
===Relevant projects of interest=== | ===Relevant projects of interest=== | ||
Revision as of 21:32, 8 January 2009
Home < 2009 Winter Project Week ChangeTracker Return to Project Week Main Page |
Key Investigators
- Andriy Fedorov, SPL
- Jim Miller, GE
- Karthik Krishnan, Kitware
- Marcel Prastawa, SCI
- Wendy Plesniak, SPL
- Luis Ibanez, Kitware
- Curtis Lisle, Knowledgevis
Objective
ChangeTracker is a software tool for quantification of the subtle changes in pathology. The module provides a workflow pipeline that combines user input with the medical data. As a result we provide quantitative volumetric measurements of growth/shrinkage together with the volume rendering of the tumor and color-coded visualization of the tumor growth/shrinkage.
The objective at this meeting is to determine the status of the Slicer3 components needed for enhanced functionality of ChangeTracker, identify new uses of ChangeTracker, and propose the tentative roadmap for ChangeTracker evolution for the next 6 months.
Approach, Plan
We consider the following improvements to ChangeTracker:
- Extending the interface to allow analysis of more than two images
- Volume rendering of tumor segmentation: visualization and 3d widget for volume cropping
- Using Lightbox for tumor progression visualization
- Robustness of initial tumor segmentation. Currently, we use user-guided thresholding. It must be quick, with minimum input from the user. Discuss possible approaches with Marcel, other groups in tumor segmentation research.
- Consider error handling interface issues in execution of an external module (how to properly handle registration errors?)
Progress
- Tumor segmentation:discussed with Luis and Karthik capabilities of LesionSizingToolkit: potentially very useful for improved accuracy of meningioma segmentation. Currently in the process of evaluating the performance of the feature detection on meningioma data
- Time-series analysis functionality in Slicer: 5-year development roadmap within NAC project. Following discussions with Wendy and Steve, currently there are no specifications or finalized plans. Advantages: improved memory efficiency and data access. Short term solution -- augmenting ChangeTracker with the capability to select the number of timepoints.
- Volume rendering: worked with Karthik, Will, Curt and Steve on fine-tuning label data volume rendering. See below for details.
- CompareView for results visualization: worked with Jim to implement changes to configure the layout with CompareView, but still debugging setting images for slice views
- Module error handling: discussed with Jim changes to the module error handling in Slicer (see below)
- Longitudinal lesion analysis in Lupus: put together a requirement document with the desired features in ChangeTracker (or ChangeTracker derivative)
"Customer" projects
Relevant projects of interest
- Longitudinal lesion analysis
- 3d widgets
- Volume rendering
- Command line program testing
- Lesion sizing toolkit
Volume rendering of label data
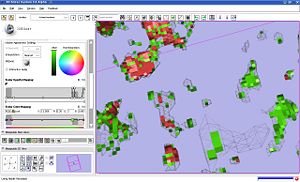
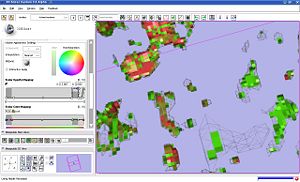
We investigated the behavior of volume rendering on the sample data from tumor growth analysis. We identified that it is crucial to use nearest neighbor interpolation for label volume rendering. It appears that the behavior of the opacity mapping function is rather unexplained (see the screenshots):
- although the input label map contains only three intensity values (background 0, shrinking 12 and growth 14), the cut-off location of the opacity mapping for the shrinking label affects rendering
- the results of volume rendering are drastically different from the surface recovered with marching cubes (see the screenshots)
Programmatic initialization of the opacity transfer function for two-label data:
  vtkPiecewiseFunction* opacity = vtkPiecewiseFunction::New();
  double* imgRange  =   this->Render_Image->GetPointData()->GetScalars()->GetRange();
  opacity->RemoveAllPoints();
  opacity->AddPoint(imgRange[0], 0.0);
  opacity->AddPoint(min - .1, 0.0);
  opacity->AddPoint(min, 1., .5, 1.);
  opacity->AddPoint(min+0.1, 0.);
  opacity->AddPoint(max-0.1, 0.);
  opacity->AddPoint(max, 1., .5, 1.);
  if (max < imgRange[1]) {
    opacity->AddPoint(max + .1, 0.);
    if (max+.1 < imgRange[1]) {
      opacity->AddPoint(max+.1, 0.);
      opacity->AddPoint(imgRange[1], 0);
    }
  }
  opacity->ClampingOff();
The datasets for testing are available here, and the transfer function can be seen on the screenshots.
Current solutions/workarounds we consider: use surface rendering from Marching cubes instead of volume rendering.
References
- E.Konukoglu, W.M.Wells, S.Novellas, N.Ayache, R.Kikinis, P.M.Black, K.M.Pohl. Monitoring Slowly Evolving Tumors. Proc. of 5th IEEE International Symposium on Biomedical Imaging: From Nano to Macro 2008, pp.812-815 link

