Difference between revisions of "Projects:ShapeAnalysisFrameworkUsingSPHARMPDM"
| Line 23: | Line 23: | ||
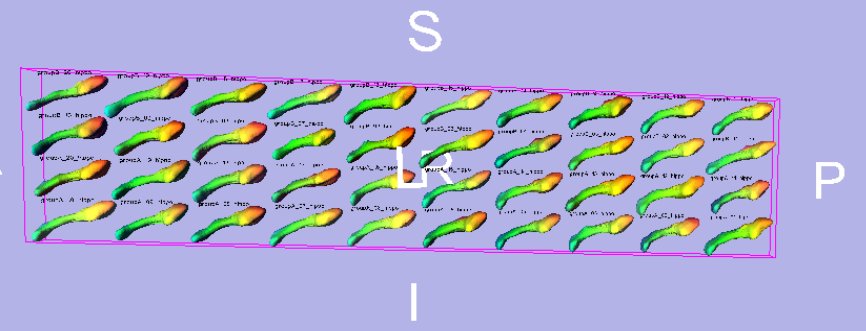
| − | [[Image: | + | [[Image:QC_ShapeAnalysisModule_PhiColorMap.jpeg|thumb|center|900px|shapeAnalysisModule: quality control with phi colormap]] |
= Key Investigators = | = Key Investigators = | ||
Revision as of 21:13, 1 April 2011
Home < Projects:ShapeAnalysisFrameworkUsingSPHARMPDMBack to NA-MIC Collaborations, UNC Algorithms, Utah Algorithms
Shape Analysis Framework using SPHARM-PDM
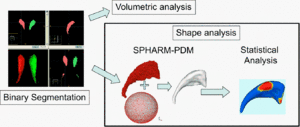
The UNC shape analysis is based on an analysis framework of objects with spherical topology, described by sampled spherical harmonics SPHARM-PDM. In summary, the input of the proposed shape analysis is a set of binary segmentation of a single brain structure, such as the hippocampus or caudate. These segmentations are first processed to fill any interior holes and a minimal smoothing operation. The processed binary segmentations are converted to surface meshes, and a spherical parametrization is computed for the surface meshes using a area-preserving, distortion minimizing spherical mapping. The SPHARM description is computed from the mesh and its spherical parametrization. Using the first order ellipsoid from the spherical harmonic coefficients, the spherical parametrizations are aligned to establish correspondence across all surfaces. The SPHARM description is then sampled into a triangulated surfaces (SPHARM-PDM) via icosahedron subdivision of the spherical parametrization. These SPHARM-PDM surfaces are all spatially aligned using rigid Procrustes alignment. Group differences between groups of surfaces are computed using the standard robust Hotelling T^2 two sample metric. An alternative testing framework applies first a Generalized Linear Model and performs testing via a MANCOVA based test statistics. Statistical p-values, both raw and corrected for multiple comparisons, result in significance maps. Additional visualization of the group tests are provided via mean difference magnitude and vector maps, as well as maps of the group covariance information.
The implementation has reached a stable framework and has been disseminated to several collaborating labs within NAMIC (BWH, GeorgiaTech, Utah) and many else outside of NAMIC.
Description
A considerable amount of work was spent on the development aspect of our shape analysis tools. The main visualization tool, KWMeshVisu, can be called directly from Slicer 3 for the overlay of scalar, vector and ellipsoid data onto surfaces (so-called attribution) and the application of a set of versatile colormaps. The display of a saved "attributed" surfaces is then again possible within Slicer 3 to close the loop. This lean visualization tool fills a niche and is also used in our cortical thickness analysis tool.
The individual shape analysis components have also been integrated into Slicer 3 modules. While it is entirely possible to run all steps of our shape analysis pipeline by calling the individual modules, this is highly inefficient. As a result we have developed a separate shape module (ShapeAnalysisModule) to executed from within Slicer3. This tool creates a script for Batchmake to run the shape analysis pipeline as a distributed, background process. The module creates a set of MRML scenes for efficient quality control via visualizations in Slicer 3. The whole shape analysis pipeline thus becomes entirely encapsulated and accessible to the trained clinical collaborator.
In addition, a novel statistical analysis was incorporated that allows to control for patient covariates (such as gender, age etc) via a Generalized Linear Model and a MANCOVA based testing framework. This also enables testing of interaction between shape and continuous patient variables such as testing scores.
It further noteworthy that the distribution (via NITRC) contains open data for other researchers to evaluate novel shape analysis enhancements.
Current modifications are focused on improving the Slicer visualizations, as well as enhancing the shape analysis pipeline to follow up SPHARM-PDM correspondence by a particle based entropy correspondence. The resulting surface are analyzed the exact same way as before, but with an improved correspondence.
Key Investigators
- UNC Algorithms: Martin Styner, Ipek Oguz, Marc Niethammer, Beatriz Paniagua, Hongtu Zhu
- Utah Algorithms: Guido Gerig
Publications
In Print
Links
- NITRC SPHARM PDM page
- Statistical shape testing framework
- Shape Analysis
- Shape Analysis LONI pipeline
- MeshVisu
- AHM2006 - LONI Shape
- Female SPD Caudates
- UNC shape analysis with Spherical Wavelet Features
Project Week Results: Jun 2005-1, Jun 2005-2, Jun 2005-3, Jan 2006-1, Jan 2006-2, Jun 2006, Jan 2007-1, Jan 2007-2

