2011 Summer Project Week long shape regression
12 sub-cortical shapes


Longitudinal Shape Regression - Huntington's Disease
Key Investigators
- Utah: James Fishbaugh, Marcel Prastawa, Guido Gerig
- Iowa: Hans Johnson
Objective
To begin processing longitudinal Huntington's disease data and to apply our shape regression framework to available data. We are interested in the evolution of sub-cortical structures in the brain.
We would like to estimate continuous growth scenarios for several shapes of interest, which can eventually be combined with a framework for 4D registration or 4D atlas construction, to statistically analyze the growth variability within a population.
Approach, Plan
- Segment sub-cortical structures
- Estimate growth trajectories
Progress
Segmentation
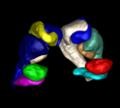
The 6 pairs of sub-cortical structures (amygdala, caudate, hippocampus, globus pallidus, putamen, lateral ventricle) were segmented using a deformable atlas based pipeline used at the University of Utah. The quality of the ventricles was very poor, so they were further improved by an active contour based segmentation tool, itkSNAP. After this stage, we have 12 shapes at 3 time points.
Preprocessing
In order to prepare the shapes for longitudinal regression, the different time points must first be rigidly aligned. We do not have point correspondences between our shapes, so we use a Gaussian mixture model based tool called gmmreg to rigidly align the shapes.
We initially align the entire shape complex, rather than individual shapes, in order to preserve the spatial relationship between the anatomical structures. However, there was a small amount of translation and rotation remaining after this process that adversely impacts the growth estimation. To further align the shapes, we also register each shape individually across time.
Regression
Here, we estimate the continuous evolution of all 12 structures as a shape complex. Three snapshots in time are shown in Fig. 1. We also investigate the evolution of shape volume, summarized in Fig 2. It is important to note that we only model the evolution of shape, and volume is simply measured continuously after regression.
Remarks
- We are unsure about the quality of the segmentations, as the volume for most segmented shapes increases from time point 2 to time point 3.
- Aside from the volume analysis, we want to estimate growth scenarios for many subjects to statistically analyze the subtle differences in shape evolution over time.


References
Fishbaugh, J., Durrleman, S., Gerig, G. "Estimation of Smooth Growth Trajectories With Controlled Acceleration From Time Series Shape Data". MICCAI 2011. To appear.