Progress Report:Shape Analysis
Collaborators: Martin Styner(UNC), Ipek Oguz (UNC), Guido Gerig (UNC), Andrew Saykin (Dartmouth), Jim Levitt (Harvard)
Description
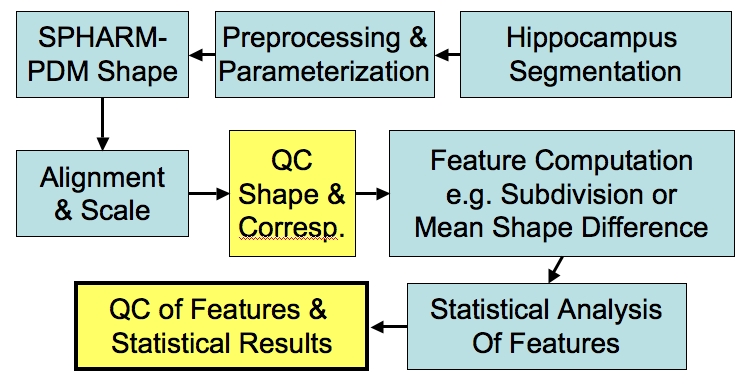
We are developing a software framework for statistical analysis of shape data for brain structures such as the hippocampus and the caudate. The framework consists of a series of modules applied in a pipeline to produce intermediate and final results of the shape analysis. During of the process automatic Quality Control visualization are produced. Additional interactive visualization tools complete the set of tools.
The following powerpoint gives a small overview of the processing of the Core 3 data from Dartmouth (Andrew Saykin): File:2005 09 NAMIC DarmouthShape.ppt and from Martha Shenton: File:2005 NAMIC ShapeSchizoBWH.ppt. Most of the items contained in the powerpoint presentation are also covered on this page.
Pipeline overview
Development within NAMIC:
- ITK/VTK/Spatial Object Viewer compatible classes for Parametrization computation, SPHARM computation, Alignment, and Visualization
- ITK based classes will soon be incorporated into ITK
- Command line tools for Pre-processing, Parametrization, SPHARM computation & Alignment, and Visualization.
- Command line tools will be incorporated into NAMIC toolkit
SPHARM computation
|
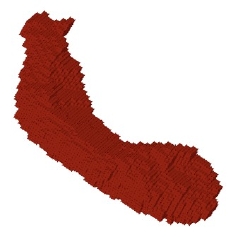
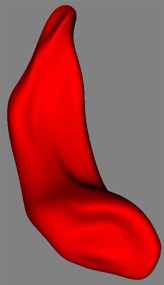
Examples on Darmouth Hippocampi. Right: Voxel based surface ("cubes") extracted from the segmentation dataset after preprocessing. The preprocessing consists of up-interpolation to a 0.5mm^3 grid, followed by a hole closing, 6-connect completion and mean curvature smoothing. Left: SPHARM surface computed from voxel based surface. Full Left: Overlay of voxel based and SPHARM surface. |
Correspondence QC
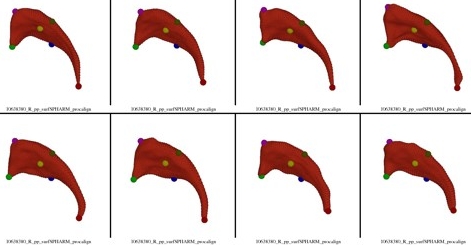
| Visualization of SPHARM Correspondence Quality Control. The image shows 8 example cases with colored spheres representing selected points on the surface. The correspondence of the colored spheres allow a visual QC of the correspondence quality. The data is from the Brockton VA caudate dataset (Cnt vs PSD) |
Shape analysis
|
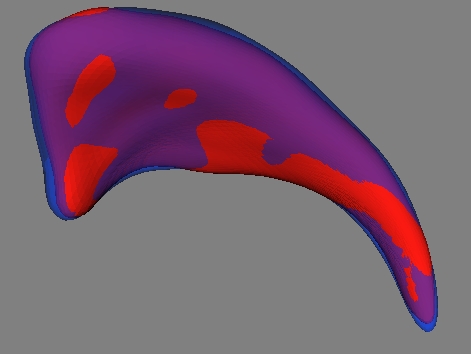
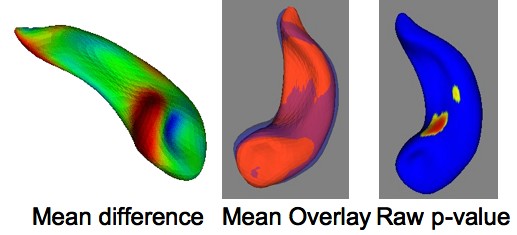
One the first things that are computed by the shape analysis tool (called StatNonParam, as it computes non-parametric statistics between groups) is the average objects of each group, as well as the distance at each point between the 2 mean structures. On the left you can see an overlay of the mean right hemispheric caudates of the 2 groups in the Brockton VA PSD study. The shape analysis tool first computes the mean shape difference between the groups (based on the mean T^2 metric across the surface), followed by the computation of the local raw p-value maps, as well as T^2 maps, ]mean-difference maps and corrected p-value maps (corrected for multiple comparison testing). The raw p-value map is overly optimistic and only the (pessimistic) corrected p-value map guaranteed correct false-positive error rate across the whole surface. Below, you can see the mean difference map and the raw p-value map for computing Left-Right asymmetry in the Dartmouth Hippocampus control dataset. |
Subdivision
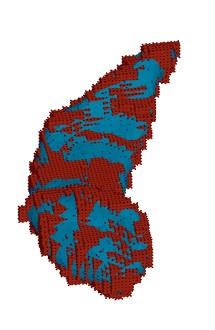
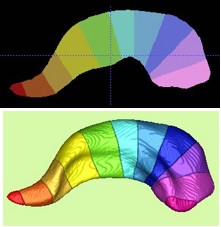
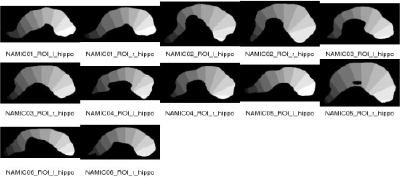
| After the local and global shape analysis, a regional analysis is the next step. We uniformly subdivide the medial axis to compute an 11 parts subdivision of the object. This subdivision is mainly driven by the geometry of the template object and the boundary correspondence to the subdivision template object. The subdivision of the Dartmouth hippocampus can be seen to the full left (both in a 2D slice, as well as in 3D). The method automatically constructs an overview QC image (as can be seen on the left). The 11 subvolumes are merged to form 3-5 regions representing the hippocampal tail, body and head. |
Visualization tools
The current set of visualization tools consists of simple viewers for the surface meshes, Fusion of meshes with local attributes (such as a p-values or a distance values), correspondence picker and viewers, . The current set of tools is quite heterogenous in regard to mesh file and mesh datatype formats. The enhancement of the tools and the consolidation of formats is one of our next steps.
Sample Applications from Core 3
Dartmouth Hippcampus Data
Some of the above images are computed from a NAMIC dataset provided by Dartmouth. As the UNC shape analysis methods were not developed with this data, but rather using data segmented using a different approach, this application shows the robustness of the UNC pipeline. Visually the segmentations differ quite a bit from our earlier segmentations and there is considerable variability in the data as it is common for hippocampus segmentations.
Timeline (processing and analysis done in less than a week):
- Data ReceptionSeptember 8th 2005
- Results and Initial version of this report September 14 2005
In the process of this application, there was no need for the adjustment of any of our tools. The tools were applied in straighforward manner and all computations were successful.
Brockton VA/Harvard Caudate Data
We have also processed a NAMIC dataset from Harvard (Brockton VA, Jim Levitt & Martha Shenton) with similar success. The development of our current tools was done alongside the application of these tools to this dataset. Both our ongoing UNC shape studies, as well as this NAMIC study have been instrumental in the development of our tools regarding stability, reliability and usability.
Next Steps in Development
- The current pipeline is a set of tools that are controlled via scripts or a pipeline system such as the LONI pipeline. Before this can be used directly by the Core 3 collaborators, a Graphical User Interface based shape analysis management tool has to be developed.
- The visualization tools have to be enhanced. Currently we use a mixed bag of tools, which have to be replaced by a small set of coherent tools. Appropriate visualizations of the statistical analysis are still missing for effect size, Hotelling T^2 map, as well as Mean Difference vector maps and Covariance ellispoid maps.
References and Upcoming Publications
- Styner M, Lieberman JA, McClure RK, Weinberger DR, Jones DW, Gerig G.: Morphometric analysis of lateral ventricles in schizophrenia and healthy controls regarding genetic and disease-specific factors, Proc Natl Acad Sci USA. 2005 Mar 29;102(13):4872-7. Epub 2005 Mar 16.
- Styner M, Lieberman JA, Pantazis D, Gerig G.: Boundary and medial shape analysis of the hippocampus in schizophrenia, Med Image Anal. 2004 Sep;8(3):197-203.
- Xu S, Styner M, Davis B, Joshi S, Gerig G. Group Mean Differences of Voxel and Surface Objects via Nonlinear Averaging, IEEE Symposium on Biomedical Imaging. IEEE Symposium on Biomedical Imaging ISBI. 2006; 758-761.
- Styner M, Jomier M, Gerig G: Closed and Open Source Neuroimage Analysis Tools and Libraries at UNC. IEEE Symposium on Biomedical Imaging ISBI. 2006; 702-705.
- Gerig G, Joshi S, Fletcher T, Gorczowski K, Xu S, Pizer SM, Styner M. Statistics of populations of images and its embedded objects: Driving applications in neuroimaging. IEEE Symposium on Biomedical Imaging ISBI. 2006; 1120-1123.
- Styner M, Gimpel Smith R, Cascio C, Oguz I, Jomier M. Corpus Callosum Subdivision based on a Probabilistic Model of Inter-hemispheric Connectivity. Medical Image Computing and Computer Assisted Interventions MICCAI. 2005 LNCS 3750;765-772.
