Projects:RegistrationDocumentation:Evaluation
Back to ARRA main page
Back to Registration main page
Back to Registration Use-case Inventory
Back to Developer page
Contents
Visualizing Registration Results
Below we discuss different forms of evaluating registration accuracy. This is not a straightforward assessment, be it qualitative or quantitative, and the requirements for evaluating registration differ with the type of input data and the questions asked.
Animated GIFs
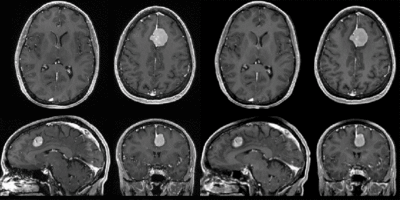
Relatively small differences can be detected, albeit qualitatively, with a quick switching between the two images.
Color Composite
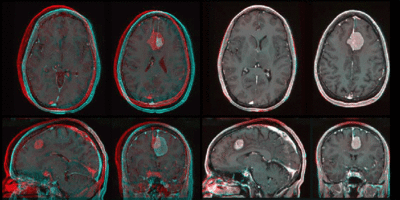
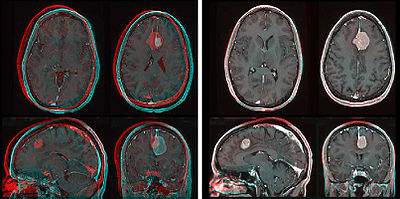
We feed the two images into the R,G or B channel of a true color image and thus create a true color image where misalignment appears in color. This may be prefereable to normal transparency because the different color channels permit a better contrast between the structures of both images in areas where they overlap.
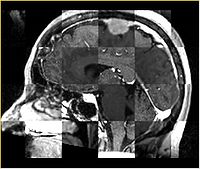
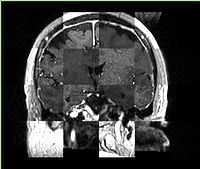
Checkerboard
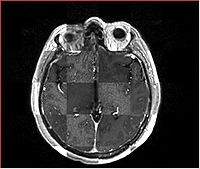
Builds a "puzzle-piece" collage of blocks from both images, alternating between the two. Helpful if the two images are from different modality or have different contrast. Continuity of edges becomes very apparent on such images.
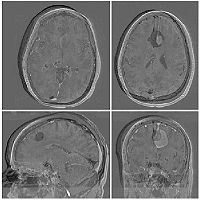
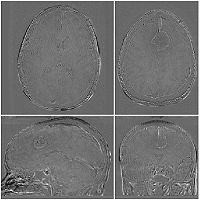
Subtraction Images
For intra-subject and intra-modality images only. The pixel-by pixel difference of the registered image pair can provide valuable information about registration quality. This usually requires at least global intensity matching to compensate for overall brightness and contrast differences.
Fiducial Pairs
To the extent that we can reliably identify anatomical landmarks in both images, we can use the residual distance of those landmarks after registration as a metric for registration accuracy. The most common problem with this approach is that (esp. for 3D images) the identification of landmarks is often already less than the registration accuracy we want to measure. This limitation is less of an issue when comparing different registrations to eachother.
Label Maps
If we have segmented structures in both images, we can use them to evaluate accuracy also. Often this is corroborated by true change, however, i.e. we face the difficult task of discriminating true anatomical change from residual misalignment.
Volume Rendering
Particularly useful to determine initial alignment for complex 3D structures. GPU restrictions may apply.
Surface Model Rendering
Particularly useful to determine initial alignment for complex 3D structures, esp. with highly locally concentrated features. Segmentation of these features can then be useful on many levels: 1) as mask for intensity based registration, 2) as models for initial alignment and verification, 3) as input data for surface-based registration, 4) as source for fiducial point selection for registration and/or evaluation
Metrics
- Compare 2 transforms: how diffferent are 2 transforms: run fiducial set through one and the invert of the other and report distance. Allow cross-fading between 2 transforms w/o creating duplicate
- Fiducial RMS Error fiducial markers set by the user on both images. Tool returns RMS distance error. Pick points inside and at the margins of your analysis ROI, i.e. if taking metrics from entire brain, use fiducials posterior and anterior, superior and inferior, because alignment quality may differ. The tool should also return the variance of RMS, because that gives an idea of possible improvement: if the error is very low in some but large in other areas, chances for improvement may be less than if a steady error bias is seen across all fiducials. Hausdorff Distance.
- ROI Similarity Metric: quick similarity metric report on a manually chosen ROI, e.g. draw a box and see the image similarity metric in that box. This could also be very useful to compare alignment quality in different regions within the image.
- Cost Function Visualizer: visualize the cost function optimization curve. and possibly a history of the tried movement: e.g. a movie of a grid/box moving thru the optimization. That will tell the user if a particular position was ever explored or not, and if/which parameters should be adjusted based on that.
- extract cost function value as registr. quality metric (-> currently via ErrorLog )
- graphic representation of registr. progress (both cartesian and cost function), maybe realtime?
- stepable movie of concatenated functions (e.g. rigd, affine, B-spline etc. visualized on simple grid/cube)
